Refer to the graph shown. 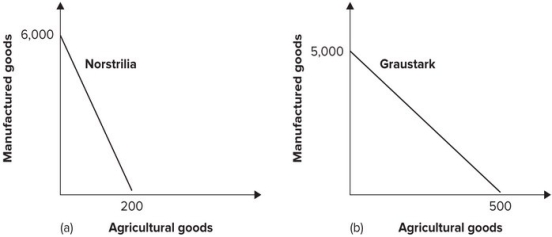 We can conclude from the diagram that:
A) Graustark has a comparative advantage in both goods.
B) Norstrilia has a comparative advantage in both goods.
C) Norstrilia has a comparative advantage in manufacturing and Graustark has a comparative advantage in agriculture.
D) Norstrilia has a comparative advantage in agriculture and Graustark has a comparative advantage in manufacturing.
Correct Answer:
Verified
Q16: Refer to the table shown. From this
Q17: We can conclude from the table shown
Q18: Suppose foreign shrimp prices drop by 32
Q19: Manufacturing wages have risen significantly for 20
Q20: Globalization represents:
A) a return to isolationism.
B) the
Q22: Production Possibility Schedules for Two South Pacific
Q23: Production Possibility Schedules for Two South Pacific
Q24: Refer to the table shown. 
Q25: Refer to the graph shown.
Q26: Refer to the table shown.
Unlock this Answer For Free Now!
View this answer and more for free by performing one of the following actions

Scan the QR code to install the App and get 2 free unlocks

Unlock quizzes for free by uploading documents