Refer to the following graphs. 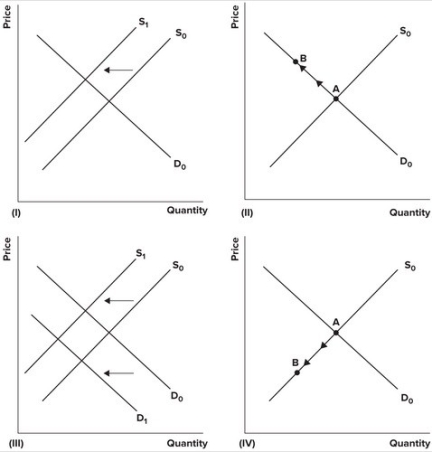 A recent report indicated that 50 intensive-care unit patients die for every 1,000 who are managed with a heart device known as the right heart catheter. Suppose as a result, the FDA limited supply of the heart catheters. The effect of the report and subsequent action by the FDA on the market for right heart catheters is best shown by which of the graphs?
A) I
B) II
C) III
D) IV
Correct Answer:
Verified
Q19: European Union subsidizes its farmers. How do
Q20: Which of the following would be the
Q21: A decrease in price and an indeterminate
Q22: Refer to the following graphs. 
Q23: When computer manufacturers overcame the enormous 13,000
Q25: Helped by desktop publishing, the number of
Q26: Suppose that there is a renewed interest
Q27: At a Chicago Bulls game 20,000 tickets
Q28: A decrease in quantity and price is
Q29: Honus Wagner, a major league baseball player
Unlock this Answer For Free Now!
View this answer and more for free by performing one of the following actions

Scan the QR code to install the App and get 2 free unlocks

Unlock quizzes for free by uploading documents