This graph shows how people have responded over time to the following question: how much of the time do you think you can trust the government in Washington to do what is right-just about always,most of the time,or only some of the time? 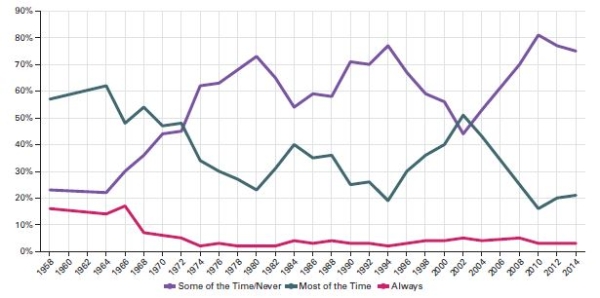 Sources: Authors' analysis of 1958-2012 American National Election Study data.As there were no election
studies for 2006,2010,and 2014,we have used the following sources for those years: December 2006 Pew
Research Center poll; February 5-10,2010 New York Times/CBS News Poll; February 2014 Pew Research
Center poll.
-Based on the graph,how has people's trust in the government changed over time?
A) More people had complete trust in the government in 2014 than ever before.
B) Fewer people trusted the government sometimes in 2014 than in 1958.-Consider This: By 2010 more people than ever before responded that they trusted the government sometimes or never.
C) People who trust the government sometimes outnumber those who trust it most of the time.
D) The government remained aligned with the people it represents from 1958-2014.
Correct Answer:
Verified
Q8: How do Internet polling companies like Knowledge
Q9: Approximately what percentage of adult citizens voted
Q10: Q11: Q12: What is demography? Q14: What is a principal provision of the Unlock this Answer For Free Now! View this answer and more for free by performing one of the following actions Scan the QR code to install the App and get 2 free unlocks Unlock quizzes for free by uploading documents![]()
![]()
A)the science of population changes
B)an

