Refer to the graph shown. The least likely cause of the shift from D1 to D2 is: 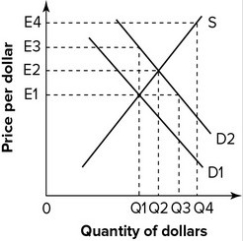
A) an increase in the U.S. inflation rate.
B) an increase in U.S. interest rates.
C) expansionary fiscal policy.
D) contractionary monetary policy.
Correct Answer:
Verified
Q55: Other things being equal, an increase in
Q56: The buying of a currency by a
Q57: In 1923, Germany experienced a very severe
Q58: Refer to the graph shown. A purchase
Q59: Refer to the graph shown. To maintain
Q61: Exchange rate fluctuations:
A)do not have economic consequences.
B)have
Q62: A country that wants to increase its
Q63: Refer to the graph shown. The purchase
Q64: Monetary policy affects exchange rates in all
Q65: Refer to the graph shown. A sale
Unlock this Answer For Free Now!
View this answer and more for free by performing one of the following actions

Scan the QR code to install the App and get 2 free unlocks

Unlock quizzes for free by uploading documents