Refer to the graph shown. The shift in the graph from D1 to D2 shows how an expansionary U.S. fiscal policy can cause an increase in: 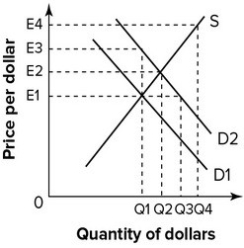
A) prices that raise the dollar's value.
B) interest rates that reduce the dollar's value.
C) prices that reduce the dollar's value.
D) interest rates that raise the dollar's value.
Correct Answer:
Verified
Q102: Purchasing power parity is used to estimate
Q103: Self-fulfilling expectations challenge the idea of a
Q104: Considering its effects through income, the price
Q105: Considering primarily the effects through the price
Q106: Considering primarily the effects through the price
Q108: Considering its effects through income, the price
Q109: The exchange rate effects of fiscal policy
Q110: The combination of expansionary U.S. monetary policy
Q111: Which of the following would most likely
Q112: Refer to the graph shown. U.S. fiscal
Unlock this Answer For Free Now!
View this answer and more for free by performing one of the following actions

Scan the QR code to install the App and get 2 free unlocks

Unlock quizzes for free by uploading documents