Refer to the graph shown. A movement from A to C is most likely to be caused by: 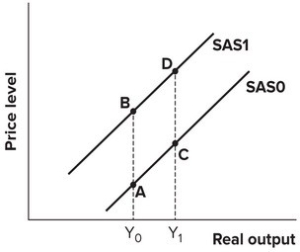
A) an increase in input prices.
B) a decrease in input prices.
C) an increase in aggregate demand.
D) a decrease in aggregate demand.
Correct Answer:
Verified
Q105: Refer to the graph shown. A decrease
Q106: Refer to the graph shown. An economy
Q107: Refer to the graph shown. An economy
Q108: An increase in aggregate demand:
A)raises potential output.
B)reduces
Q109: Refer to the graph shown. A movement
Q111: A change in which of the following
Q112: If actual output exceeds potential output for
Q113: The short-run aggregate supply curve is most
Q114: The long-run aggregate supply curve shows the
Q115: If productivity increases by 3 percent but
Unlock this Answer For Free Now!
View this answer and more for free by performing one of the following actions

Scan the QR code to install the App and get 2 free unlocks

Unlock quizzes for free by uploading documents