Refer to the graph shown. A movement from D to B is most likely to be caused by: 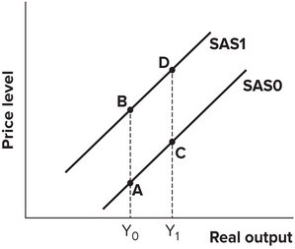
A) an increase in expected inflation.
B) a decrease in input prices.
C) a decrease in import prices.
D) a decrease in aggregate demand.
Correct Answer:
Verified
Q99: In early 2000s, oil prices were rising
Q100: Refer to the following graph. 
Q101: Refer to the graph shown. A movement
Q102: In the long run, the position of
Q103: Refer to the graph shown. A decrease
Q105: Refer to the graph shown. A decrease
Q106: Refer to the graph shown. An economy
Q107: Refer to the graph shown. An economy
Q108: An increase in aggregate demand:
A)raises potential output.
B)reduces
Q109: Refer to the graph shown. A movement
Unlock this Answer For Free Now!
View this answer and more for free by performing one of the following actions

Scan the QR code to install the App and get 2 free unlocks

Unlock quizzes for free by uploading documents