Consider the following diagram 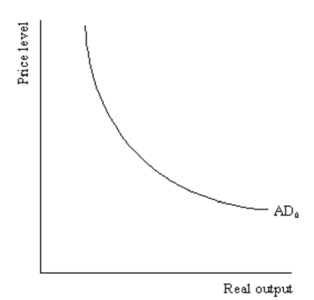 Demonstrate graphically and explain verbally the impact of a decrease of 50 in government spending on the AD curve in the diagram when the multiplier is 3.
Correct Answer:
Verified
View Answer
Unlock this answer now
Get Access to more Verified Answers free of charge
Q23: Suppose the economy is in an inflationary
Q194: Describe two distinct and opposing effects that
Q208: What are the three ways that falling
Q209: In 2001,the U.S.economy suffered a mild recession.As
Q210: Demonstrate graphically and explain verbally the case
Q211: Assuming the economy is in long-run equilibrium,using
Q212: For each of the following "quotes" from
Q214: What factors shift the short-run aggregate supply
Q218: Demonstrate graphically and explain verbally a recessionary
Q220: What is deflation? What could deflation do
Unlock this Answer For Free Now!
View this answer and more for free by performing one of the following actions

Scan the QR code to install the App and get 2 free unlocks

Unlock quizzes for free by uploading documents