The figure below shows two regions (p17 and V3) of the HIV genome in the same patient. Which of the following conclusions can be drawn from the graph? 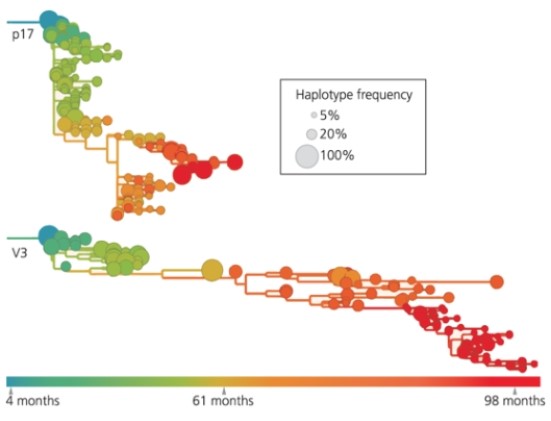
A) V3 has gone through more evolutionary change than p17.
B) p17 is less tolerant of mutations than V3.
C) Mutations in the V3 region are likely to have neutral or positive effects.
D) all of the above
Correct Answer:
Verified
Q16: Which of the following diseases does not
Q17: The weakened viruses contained in live-virus vaccines
Q18: Which of the following viruses is incorrectly
Q19: Individuals who inherit silent or defective alleles
Q20: Two copies of the HbS allele cause
Q22: Which of the following processes help(s) to
Q23: Mutations that increase the risk of breast
Q24: The e4 allele is common in the
Q25: What were Ron Fouchier and colleagues trying
Q26: In the following figure, what does the
Unlock this Answer For Free Now!
View this answer and more for free by performing one of the following actions

Scan the QR code to install the App and get 2 free unlocks

Unlock quizzes for free by uploading documents