The line in the following graph shows that over time 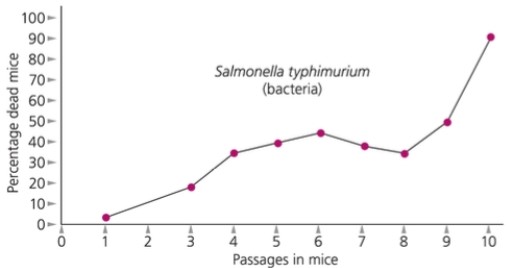
A) mice become less susceptible to disease.
B) mice become more susceptible to disease.
C) bacteria evolve from low to high virulence.
D) bacteria evolve from high to low virulence.
Correct Answer:
Verified
Q46: The relationship between the presence of malaria
Q47: What is the name of the phenomenon
Q48: There are many hypotheses about why obesity
Q49: At present, what is the most common
Q50: Which of the following scenarios best illustrates
Q52: What does the flu virus use the
Q53: Which of the following statements best describes
Q54: Increases in the average life span since
Q55: Evolving very rapidly (hypermutation) would favor bacteria
Q56: What fraction of human proteins have evolved
Unlock this Answer For Free Now!
View this answer and more for free by performing one of the following actions

Scan the QR code to install the App and get 2 free unlocks

Unlock quizzes for free by uploading documents