The graph below shows the reproductive success for males of two different species as a function of the number of mates they obtain. For which species would you expect sexual selection on males to be stronger? 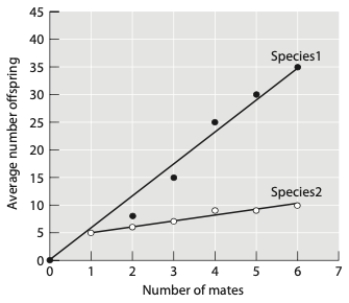
A) species 2; males of species 2 are expected to compete less strongly over access to females
B) species 1; males of species 1 are expected to compete less over access to females
C) species 2; males of species 2 are expected to compete more strongly over access to females
D) species 1; males of species 1 are expected to compete more strongly over access to females
Correct Answer:
Verified
Q33: Which of the following is not an
Q34: Define each of the following terms and
Q35: According to sexual selection theory, a male
Q36: Compare the three hypotheses that explain the
Q37: Which of the following supports sexual conflict
Q39: Phalaropes are shore birds with brightly colored
Q40: All of the following are true of
Q41: You are studying the potential for sexual
Q42: Describe two costs and two benefits of
Q43: Explain three different mechanisms of sexual selection
Unlock this Answer For Free Now!
View this answer and more for free by performing one of the following actions

Scan the QR code to install the App and get 2 free unlocks

Unlock quizzes for free by uploading documents