The RC and More Superstore decides to track customer complaints as part of their ongoing customer satisfaction improvement program. After collecting data for two months, their check sheet appears as follows: 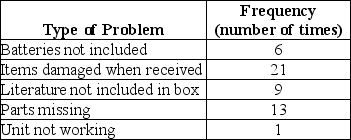 If they construct a Pareto chart, how many of these categories are required to make up 86% of all complaints?
A) 1
B) 2
C) 3
D) 4
E) 5
Correct Answer:
Verified
Q23: _ are used to identify and prioritize
Q24: The RC and More Superstore decides to
Q25: Calculate the number of classes if there
Q26: _ are frequency charts that are aided
Q27: _ are used to determine whether a
Q29: The _ is used to examine the
Q30: _ are simply graphical representations of data
Q31: The RC and More Superstore decides to
Q32: The cause-and-effect diagram is also called a(n)
Q33: The RC and More Superstore decides to
Unlock this Answer For Free Now!
View this answer and more for free by performing one of the following actions

Scan the QR code to install the App and get 2 free unlocks

Unlock quizzes for free by uploading documents