Consider the graph below.This shows the results of an experiment training condition as the independent variable and employee IQ as the covariate. 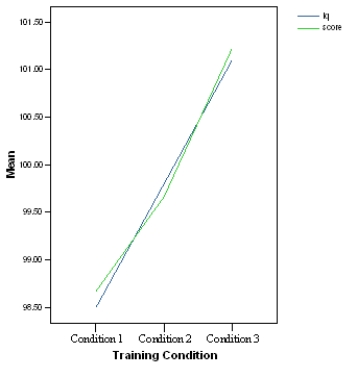 What does the graph indicate?
A) Although the independent variable has had an effect on the dependent variable,the covariate is the more likely explanation of effect.
B) The training condition has altered IQ.
C) IQ has altered learning condition.
D) Not enough information.
Correct Answer:
Verified
Q1: Which of these statements is not true
Q4: In an ANCOVA with one covariate and
Q5: The first part of the SPSS output
Q6: In an experiment to study the effectiveness
Q7: To 'partial out' means to?
A) Examine the
Q7: The second part of SPSS output for
Q8: Adjusted group means for a sample of
Q9: What is not true of the ANCOVA
Q10: What assumption does ANCOVA have that ANOVA
Q16: Under which circumstance(s) should you avoid using
Unlock this Answer For Free Now!
View this answer and more for free by performing one of the following actions

Scan the QR code to install the App and get 2 free unlocks

Unlock quizzes for free by uploading documents