Looking at the graph below,which of the following statements are correct? 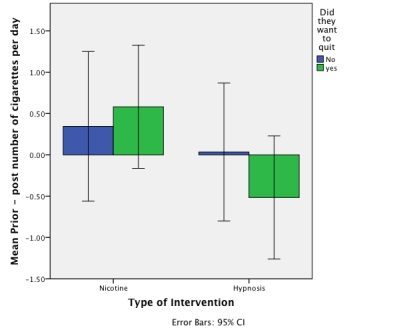
A) On average,for those who wanted to quit smoking,the nicotine patches reduced the number of cigarettes smoked per day,whereas hypnosis actually increased the number of cigarettes smoked per day.
B) On average,the nicotine intervention was more successful in those who wanted to quit smoking than in those who did not want to quit,whereas the hypnosis intervention was more successful in those who did not want to quit smoking than in those who did.
C) All of the statements are correct.
D) Overall,the nicotine intervention was the most successful at reducing the number of cigarettes smoked per day.
Correct Answer:
Verified
Q2: In IBM SPSS,what is this graph known
Q5: In IBM SPSS,the following graph is known
Q5: Imagine we took a group of smokers,
Q6: What is the graph below known as?
Q8: Approximately what is the mean success score
Q9: Based on the chart,what was the interquartile
Q10: Looking at the graph below,approximately what was
Q11: Looking at the graph below,which intervention was
Q12: Based on the chart,what was the median
Q13: What does a histogram show?
A)A histogram is
Unlock this Answer For Free Now!
View this answer and more for free by performing one of the following actions

Scan the QR code to install the App and get 2 free unlocks

Unlock quizzes for free by uploading documents