What does the relationship of the data in the following scatterplot indicate? 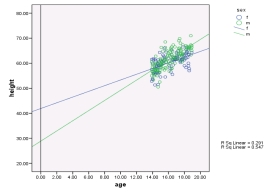
A) A positive relationship where height increases with age for both sexes
B) A larger relationship for males
C) A negative relationship for both sexes
D) None of the above
Correct Answer:
Verified
Q1: A health psychologist was interested in the
Q2: Which of the following is not considered
Q7: A music teacher had noticed that some
Q7: In an ANCOVA with one covariate and
Q9: Adjusted group means are
A) Means across all
Q9: A scatterplot and a summary table for
Q10: What assumption does ANCOVA have that ANOVA
Q13: A music teacher had noticed that some
Q15: What makes ANCOVA different from ANOVA?
A) ANCOVA
Q16: What is not true of the ANCOVA
Unlock this Answer For Free Now!
View this answer and more for free by performing one of the following actions

Scan the QR code to install the App and get 2 free unlocks

Unlock quizzes for free by uploading documents