Use the information below to answer the following question(s) .Use the "Factors for Control Limits" Table A.3 from the textbook where required:
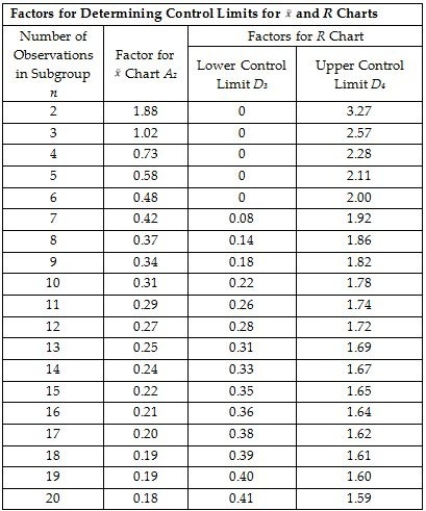 A control chart needs to be developed to determine if the temperature for a process is within control limits.Five samples each having 4 observations are taken and the sample measurements (temperature in degrees F) are noted in the table below:
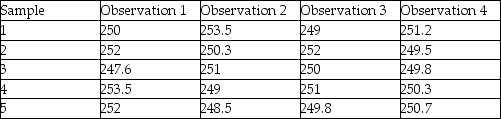
-What is the value of the average range R-bar?
A) 3.68
B) 8.398
C) 3.125
D) 5.252
Correct Answer:
Verified
Q22: Every 10th product coming off a production
Q23: The ratio between the cost of inspection
Q24: Samples which are ordered by time or
Q25: A bottling plant measures the volume of
Q26: A continuous measurement such as weight,height,or volume
Q28: A control chart needs to be developed
Q29: Use the information below to answer the
Q30: For process control charts,using control limits corresponding
Q31: Quality inspection performed during the production process
Q32: A control chart needs to be developed
Unlock this Answer For Free Now!
View this answer and more for free by performing one of the following actions

Scan the QR code to install the App and get 2 free unlocks

Unlock quizzes for free by uploading documents