Figure 15-3 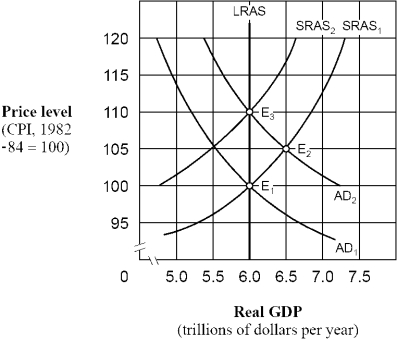
-As shown in Figure 15-3, if people behave according to adaptive expectations theory, an increase in the aggregate demand curve from AD1 to AD2 will cause the price level to move
A) directly from 100 to 110 and then remain at 110.
B) directly from 100 to 105 and then remain at 105.
C) from 100 to 105 initially and then eventually move back to 100.
D) from 100 to 105 initially and then eventually move to 110.
Correct Answer:
Verified
Q12: According to the rational expectations theory, expansionary
Q14: The rational expectations hypothesis implies that discretionary
Q48: In order to make effective policy changes,
Q78: The interval between the recognition of a
Q102: Which of the following is part of
Q106: The modern view of the Phillips curve
Unlock this Answer For Free Now!
View this answer and more for free by performing one of the following actions

Scan the QR code to install the App and get 2 free unlocks

Unlock quizzes for free by uploading documents