Figure 15-3 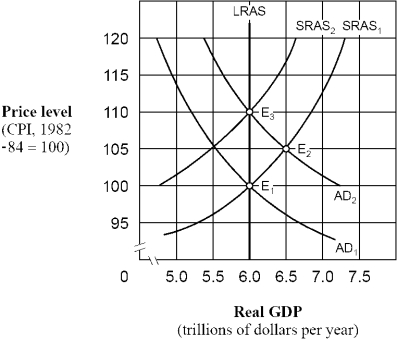
-As shown in Figure 15-3, if people behave according to adaptive expectations theory, an increase in the aggregate demand curve from AD1 to AD2 will cause
A) labor to adjust nominal wages sluggishly.
B) the aggregate supply curve to shift from SRAS1 to SRAS2
C) the price level to eventually rise from 100 to 110.
D) All of the above.
Correct Answer:
Verified
Q7: The integration of expectations into macroeconomic analysis
Q31: According to the adaptive expectations hypothesis, people
Q42: Which combination of signals would be a
Q47: The effectiveness of monetary policy as a
Q120: Suppose the annual rate of inflation has
Q161: How has macro-policy changed since the 1970s?
Q163: What are the proper monetary and fiscal
Q164: What will actual unemployment be (in relation
Q165: Explain the three lags that make it
Q167: What are the two theories about how
Unlock this Answer For Free Now!
View this answer and more for free by performing one of the following actions

Scan the QR code to install the App and get 2 free unlocks

Unlock quizzes for free by uploading documents