Use the figure below to answer the following questions.
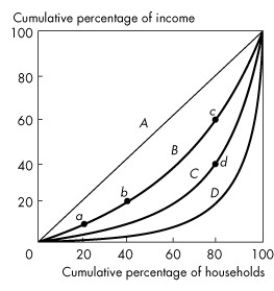
Figure 19.1.2
-Consider the Lorenz curves in Figure 19.1.2.Which point indicates that the richest 20 percent of families earn 60 percent of the income?
A) a
B) b
C) c
D) d
E) none of the above
Correct Answer:
Verified
Q5: Total income equals
A)market income minus payments to
Q10: The closer the Lorenz curve is to
Q16: In 2009,the poorest 20 percent of households
Q17: A Lorenz curve illustrates the distribution of
Q20: In 2009,the mean household income in Canada
Q22: Use the figure below to answer the
Q26: Use the figure below to answer the
Q28: Which diagram is used by economists to
Q28: Poverty is
A)an income below the national average
Q38: In Canada,the low-income cut-off level for a
Unlock this Answer For Free Now!
View this answer and more for free by performing one of the following actions

Scan the QR code to install the App and get 2 free unlocks

Unlock quizzes for free by uploading documents