Use the figure below to answer the following questions.
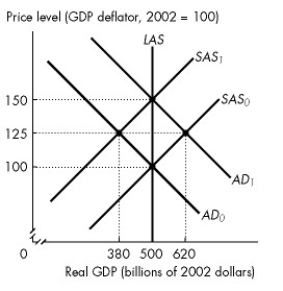
Figure 28.1.3
-Refer to Figure 28.1.3.Assume that the figure illustrates an economy initially in equilibrium at the intersection of the SAS? curve and the AD? curve.If the aggregate demand curve is correctly expected to shift to AD?,new equilibrium real GDP is ________ and the new equilibrium price level is ________.
A) $380 billion;125
B) $500 billion;150
C) $500 billion;100
D) $620 billion;125
E) $500 billion;125
Correct Answer:
Verified
Q28: The economy starts out at a full-employment
Q29: Use the figure below to answer the
Q30: Use the figure below to answer the
Q32: When the price level is rising and
Q34: Use the figure below to answer the
Q35: Use the figure below to answer the
Q44: A forecast based on all the relevant
Q57: A correctly anticipated increase in the quantity
Q68: A forecast that is based on all
Q70: Suppose that the money prices of raw
Unlock this Answer For Free Now!
View this answer and more for free by performing one of the following actions

Scan the QR code to install the App and get 2 free unlocks

Unlock quizzes for free by uploading documents