Exhibit 10-3
An engineer collected data from three different types of power drills.Specifically, the engineer collected data on how long (in minutes) each type of drill would run continuously after a full battery recharge.Each drill was charged and run continuously 15 times.The reported data are contained in the following table.The engineer analyzed the data using one-way ANOVA in Excel and the results from Excel are also given below.

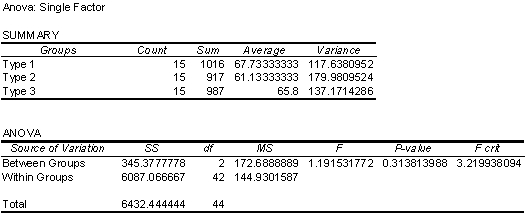
-Refer to Exhibit 10-3.The one-way ANOVA was used to determine if the population mean continuous run times are equal (the null hypothesis) for all three types of drills,or if all pairs of population means are not equal (the alternative hypothesis) .Which decisions could the manager make?
A) Reject the null hypothesis using a 5% significance level, and reject the null hypothesis using a 1% significance level.
B) Reject the null hypothesis using a 5% significance level, but do not reject the null hypothesis using a 1% significance level.
C) Reject the null hypothesis using a 1% significance level, but do not reject the null hypothesis using a 5% significance level.
D) Do not reject the null hypothesis using a 5% significance level, and do not reject the null hypothesis using a 1% significance level.
Correct Answer:
Verified
Q39: A manager at a local manufacturing company
Q40: Statistical thinking is a philosophy of learning
Q41: A manager at a market research firm
Q42: Special causes of variation are often called
Q43: Exhibit 10-2
A manager of a hotel chain
Q45: Understanding processes provides the context for determining
Q46: Sample _ are often used as estimators
Q47: Exhibit 10-3
An engineer collected data from three
Q49: _ arise from external sources that are
Q53: A government report gives a 99% confidence
Unlock this Answer For Free Now!
View this answer and more for free by performing one of the following actions

Scan the QR code to install the App and get 2 free unlocks

Unlock quizzes for free by uploading documents