An object starts its motion with a constant velocity of 2.0 m/s toward the east. After 3.0 s, the object stops for 1.0 s. The object then moves toward the west a distance of 2.0 m in 3.0 s. The object continues traveling in the same direction, but increases its speed by 1.0 m/s for the next 2.0 s. Which graph below could represent the motion of this object?
A) 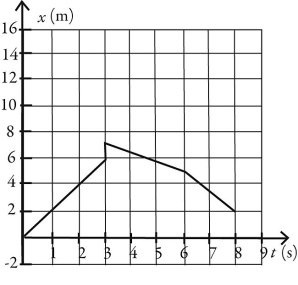
B) 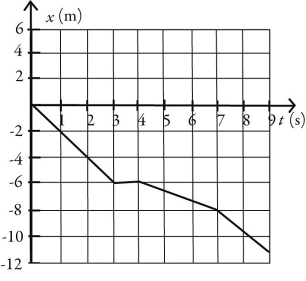
C) 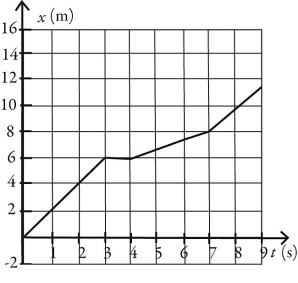
D) 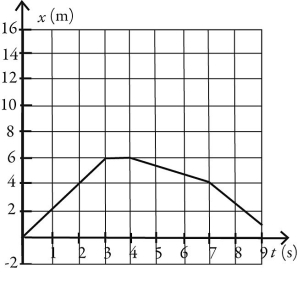
Correct Answer:
Verified
Q13: Two objects are thrown from the top
Q15: The figure shows the graph of the
Q16: The graph in the figure shows the
Q17: An object is moving in a straight
Q18: The motion of a particle is described
Q20: Which one of the following graphs could
Q21: The velocity of an object is given
Q23: The acceleration of an object as a
Q24: If the fastest you can safely drive
Q37: A dragster starts from rest and travels
Unlock this Answer For Free Now!
View this answer and more for free by performing one of the following actions

Scan the QR code to install the App and get 2 free unlocks

Unlock quizzes for free by uploading documents