Multiple Choice
Figure 15-16 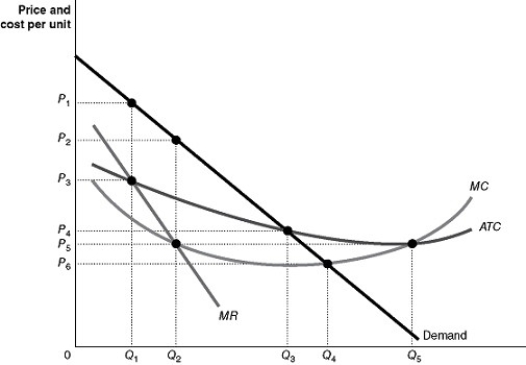 Figure 15-16 shows the market demand and cost curves facing a natural monopoly.
-Refer to Figure 15-16. If the regulators of the natural monopoly allow the owners of the firm to break even on their investment the firm will produce an output of ________ and charge a price of ________.
A) Q1 units; P4
B) Q1 units; P1
C) Q5 units; P3
D) Q3 units; P4
Correct Answer:
Verified
Related Questions
Q242: Merger guidelines developed by the U.S.Department of
Q243: Figure 15-17 Q244: Figure 15-17 Q249: The Herfindahl-Hirschman Index is one factor used
![]()
![]()

