The graph below depicts the cost structure for a firm in a competitive market.
Figure 9-13 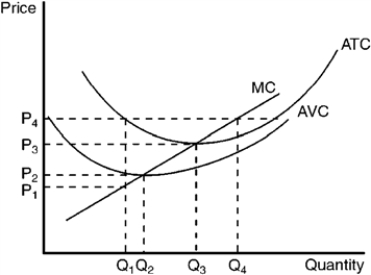
-Refer to Figure 9-13. When price rises from P2 to P3, the firm finds that
A) marginal cost exceeds marginal revenue at a production level of Q2.
B) if it produces at output level Q3 it will earn a positive profit.
C) expanding output to Q4 would leave the firm with losses.
D) it could increase profits by lowering output from Q3 to Q2.
Correct Answer:
Verified
Q76: Use the figure to answer the following
Q77: Use the figure to answer the following
Q78: When the price of a product rises,
Q79: In price-taker markets, individual firms have no
Q80: If marginal revenue exceeds marginal cost, a
Q82: Use the figure to answer the following
Q83: Use the figure to answer the following
Q84: Use the figure to answer the following
Q85: Use the figure to answer the following
Q86: Use the figure to answer the following
Unlock this Answer For Free Now!
View this answer and more for free by performing one of the following actions

Scan the QR code to install the App and get 2 free unlocks

Unlock quizzes for free by uploading documents