Use the figure below to answer the following question(s) .
Figure 4-7 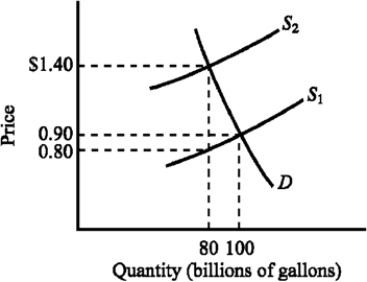
-Refer to Figure 4-7. The supply curve S1 and the demand curve D indicate initial conditions in the market for gasoline. A $.60-per-gallon excise tax on gasoline is levied. How much revenue does the $.60-per-gallon tax generate for the government?
A) $40 billion
B) $48 billion
C) $50 billion
D) $60 billion
Correct Answer:
Verified
Q28: Use the figure below to answer the
Q29: Use the figure below illustrating the impact
Q30: Use the figure below to answer the
Q31: Use the figure below to answer the
Q32: Use the figure below to answer the
Q34: Use the figure below to answer the
Q35: Use the figure below to answer the
Q36: Use the figure below illustrating the impact
Q37: Use the figure below illustrating the impact
Q38: Use the figure below to answer the
Unlock this Answer For Free Now!
View this answer and more for free by performing one of the following actions

Scan the QR code to install the App and get 2 free unlocks

Unlock quizzes for free by uploading documents