Solved

Use the Figure Below to Answer the Following Question(s)

Question 40

Multiple Choice

Use the figure below to answer the following question(s) .
Figure 4-8 Use the figure below to answer the following question(s) . Figure 4-8   -Refer to Figure 4-8. The supply curve S<sub>1</sub> and the demand curve D indicate initial conditions in the market for soft coal. A $40-per-ton tax on soft coal is levied, shifting the supply curve from S<sub>1</sub> to S<sub>2</sub>. Imposing the tax increases the equilibrium price of soft coal from A)  $20 to $60 per ton. B)  $20 to $50 per ton. C)  $50 to $60 per ton. D)  $50 to $90 per ton.
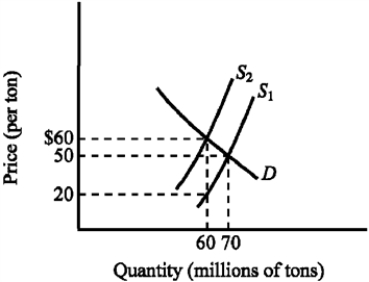
-Refer to Figure 4-8. The supply curve S1 and the demand curve D indicate initial conditions in the market for soft coal. A $40-per-ton tax on soft coal is levied, shifting the supply curve from S1 to S2. Imposing the tax increases the equilibrium price of soft coal from


A) $20 to $60 per ton.
B) $20 to $50 per ton.
C) $50 to $60 per ton.
D) $50 to $90 per ton.

Correct Answer:

verifed

Verified

Unlock this answer now
Get Access to more Verified Answers free of charge

Related Questions

Unlock this Answer For Free Now!

View this answer and more for free by performing one of the following actions

qr-code

Scan the QR code to install the App and get 2 free unlocks

upload documents

Unlock quizzes for free by uploading documents