Case-Based Critical Thinking Questions
Case 3-1
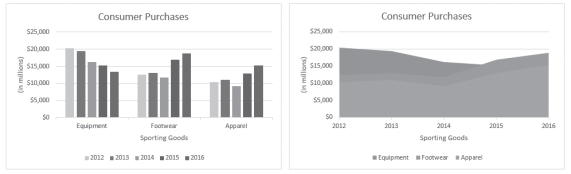
Column Chart Area Chart
Sarah has put together the same information in two different charts, shown in the figure above, to present to her boss. She is thinking through the pros and cons of each chart type.
-If Sarah wanted to focus on and display the percentage contribution that each category makes to the whole, which chart type would work best?
A) surface
B) pie
C) scatter
D) radar
Correct Answer:
Verified
Q114: By Columns By Rows Q115: In a bubble chart, the larger the Q116: Case-Based Critical Thinking Questions Q117: The _ is the descriptive text that Q118: _ are small word-sized charts or graphics Q120: Microsoft Excel can be used to provide Q121: MATCHING Q122: The _ dialog box, which is available Q123: MATCHING Q124: MATCHING Unlock this Answer For Free Now! View this answer and more for free by performing one of the following actions Scan the QR code to install the App and get 2 free unlocks Unlock quizzes for free by uploading documents
![]()
Case 3-1

![]()
![]()
![]()

