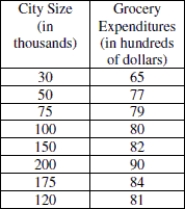
Use the data provided in the table below to answer the question. The table shows city size and annual grocery expenditures for eight families. City size is in thousands and expenditures is in hundreds of dollars.
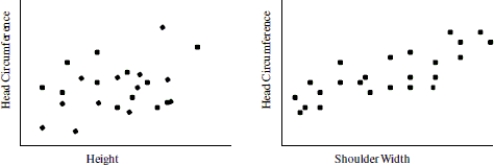
-Based on the scatterplots below, what is the better predictor for head circumference-- height or shoulder width? Explain how you made your decision.
Correct Answer:
Verified
View Answer
Unlock this answer now
Get Access to more Verified Answers free of charge
Q50: Use the regression equation to predict how
Q51: A horticulturist conducted an experiment on 120
Q52: Use the following information to answer the
Q53: State the slope and intercept of the
Q54: Suppose that environmentalists monitor algae levels in
Q55: The figures below show the relationship between
Q57: The scatterplot below shows the number of
Q58: Suppose that runner height (in inches)and finish
Q59: Suppose that in the Midwest, it is
Q60: Use the data provided in the table
Unlock this Answer For Free Now!
View this answer and more for free by performing one of the following actions

Scan the QR code to install the App and get 2 free unlocks

Unlock quizzes for free by uploading documents