Use the following information to answer the question. A scatterplot of data from a large sample of adult women shows that height in inches and weight in pounds have a linear association. Shown below are the outputs from two different statistical technologies (TI- 83/84 Calculator and Excel).
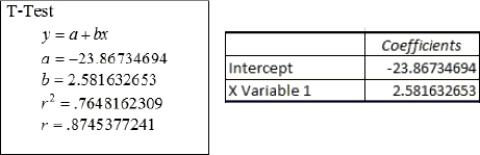
-Height and weight charts for women show that a woman who is 71 inches tall has a target weight between 135 and 176 pounds. Would the regression model you found for the large sample of (in question 15)place a woman who was 71 inches tall within this range?
Correct Answer:
Verified
Q39: Use the following information to answer the
Q40: Use the following information to answer the
Q41: Use the data provided in the table
Q42: The following regression equation was found to
Q43: Explain in your own words what extrapolation
Q45: State the explanatory variable and the response
Q46: If the correlation between whole milk content
Q47: Use the data provided in the table
Q48: The scatterplot below shows the ice cream
Q49: The following regression equation was found to
Unlock this Answer For Free Now!
View this answer and more for free by performing one of the following actions

Scan the QR code to install the App and get 2 free unlocks

Unlock quizzes for free by uploading documents