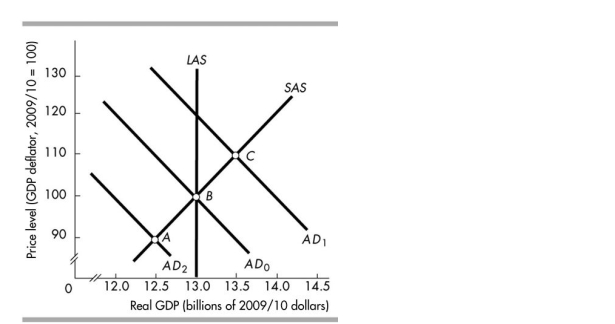
-In the above figure, point A represents
A) an inflationary gap.
B) an increase in aggregate demand.
C) a full- employment equilibrium.
D) a recessionary gap.
Correct Answer:
Verified
Q10: The short- run aggregate supply curve is
Q11: Technological progress will
A)shift the SAS curve rightward
Q12: Q13: Which of the following helps determine the Q14: The AS/AD model studies the relationship between Q16: The short- run aggregate supply curve shifts Q17: Which of the following statements is FALSE? Q18: An aggregate supply curve depicts the relationship Q19: Keynesian macroeconomists recommend Q20: The long- run aggregate supply (LAS)curve![]()
A)the
A)Taxes
A)policies that actively offset the
A)has a
Unlock this Answer For Free Now!
View this answer and more for free by performing one of the following actions

Scan the QR code to install the App and get 2 free unlocks

Unlock quizzes for free by uploading documents