Figure 4A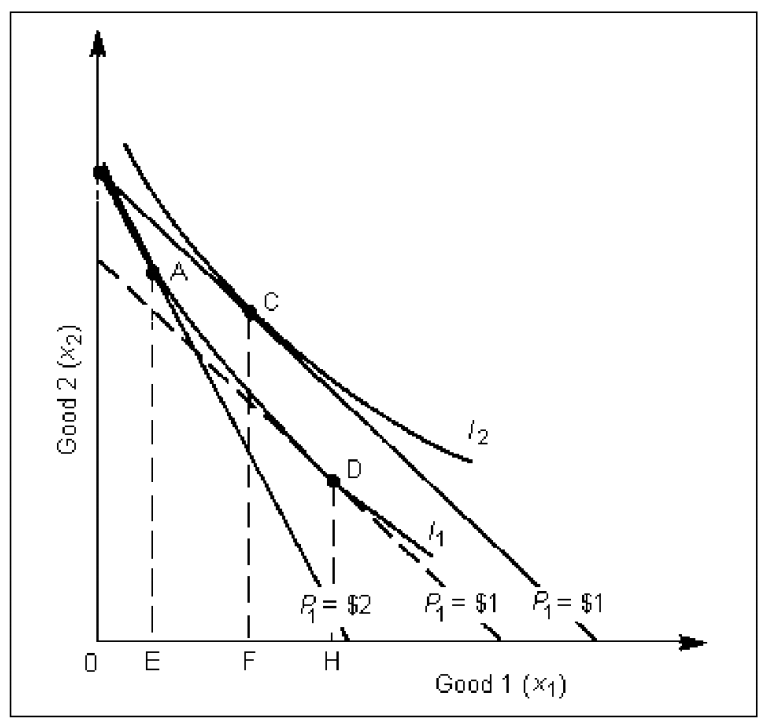
-The indifference map in Figure 4A illustrates the effect of a:
A) price decrease in x1.
B) price increase in x2.
C) change in the consumer's income.
D) price decrease in x2.
Correct Answer:
Verified
Q57: A round of golf at the Capilano
Q58: For an inferior good:
A)the income effect is
Q59: When EV = CV = CS:
A)the good
Q60: Joe's utility function is given by U(x,y)=
Q61: Joe's utility function is given by U(x,y)=
Q63: The income effect is:
A)the change in utility
Q64: If the Paasche quantity index is less
Q65: The compensated budget line:
A)is parallel with the
Q66: The Paasche and the Laspeyres indexes:
A)give the
Q67: When the price of a good changes,
Unlock this Answer For Free Now!
View this answer and more for free by performing one of the following actions

Scan the QR code to install the App and get 2 free unlocks

Unlock quizzes for free by uploading documents