Refer to the following figure:
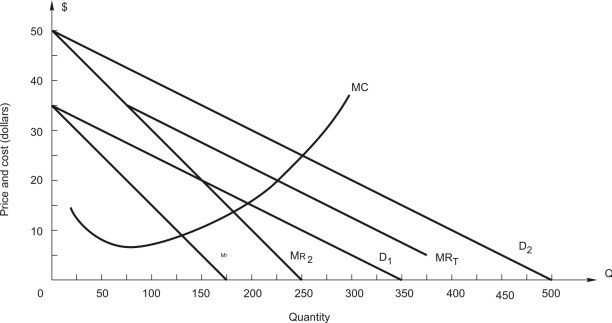
The graph shows the demands and marginal revenue in two markets, 1 and 2, for a price discriminating firm along with total marginal revenue, MRT, and marginal cost.
-At the optimal price and quantity, what is demand elasticity in each market?
A) E1 =-3.67, E2 = -2.33
B) E1 =-03, E2 = -4
C) E1 = -2.5, E2 = -3.5
D) E1 = -3, E2 = -3
E) E1 = -1.67, E2 = -2.33
Correct Answer:
Verified
Q30: Refer to the following:
Q30: Gus has 20 acres of land in
Q31: Refer to the following:
Q32: Relate to the following:
A firm is
Q33: Refer to the following figure:

Q35: Refer to the following:
A firm sells
Q36: Refer to the following:
A firm sells
Q37: Refer to the following:
A news magazine offers
Q38: Refer to the following figure:
Q39: Refer to the following:
A firm sells
Unlock this Answer For Free Now!
View this answer and more for free by performing one of the following actions

Scan the QR code to install the App and get 2 free unlocks

Unlock quizzes for free by uploading documents