Multiple Choice
Use the figure below, which shows a linear demand curve and the associated total revenue curve, to answer the questions. 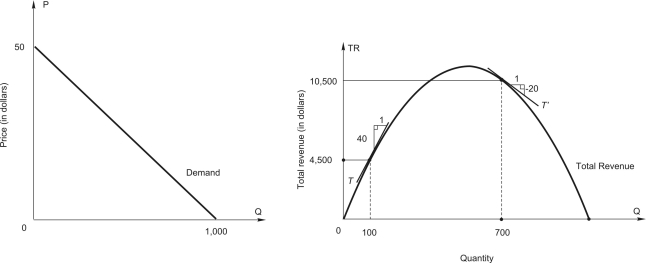
-The price for which 100 units can be sold is $_____.
A) 10
B) 15
C) 25
D) 45
E) 50
Correct Answer:
Verified
Related Questions
Q7: Interior Department recently announced that it will
Q10: the demand for umbrellas is price inelastic,
A)changes
Q15: Use the figure below, which shows a
Q17: Use the figure below, which shows a
Unlock this Answer For Free Now!
View this answer and more for free by performing one of the following actions

Scan the QR code to install the App and get 2 free unlocks

Unlock quizzes for free by uploading documents