Refer to the following graphs: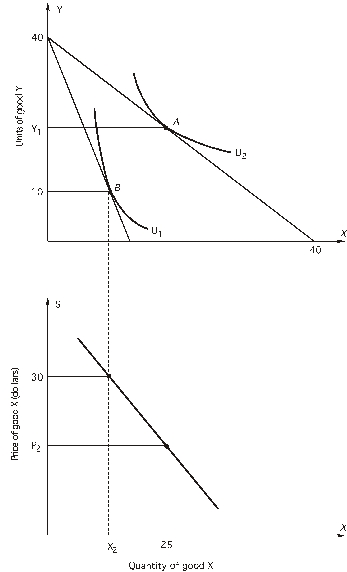
The price of Y is $15 per unit.
-What does the curve in the lower graph show?
A) how a consumer's utility-maximizing choices of X and Y change when the budget constraint changes
B) how a consumer's preferences change when income changes
C) how a consumer's utility-maximizing choices of X changes when the price of X changes
D) how a consumer's utility-maximizing choices of Y changes when the price of Y changes
E) both c and d
Correct Answer:
Verified
Q46: For questions assume that an
Q47: Lord Greystroke uses his limited income to
Q48: For questions assume that an
Q49: Refer to the following graphs of a

Unlock this Answer For Free Now!
View this answer and more for free by performing one of the following actions

Scan the QR code to install the App and get 2 free unlocks

Unlock quizzes for free by uploading documents