TABLE 2-16
The figure below is the percentage polygon for the amount of calories for a sample of 36 pizzas products where the upper limits of the intervals are: 310, 340, 370, 400 and 430.
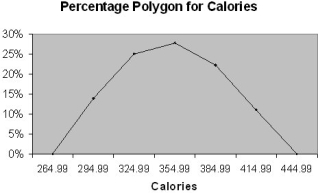
-Referring to Table 2-16, roughly what percentage of pizza products contains between 340 and 400 calories?
A) 50%
B) 28%
C) 25%
D) 22%
Correct Answer:
Verified
Q53: Data on the number of credit hours
Q57: When comparing two or more large batches
Q62:
Q70: TABLE 2-8
The Stem-and-Leaf display represents the number
Q76: TABLE 2-9
The frequency distribution below represents the
Q81: TABLE 2-11
The ordered array below resulted from
Q141: TABLE 2-12
The table below contains the opinions
Q160: TABLE 2-12
The table below contains the opinions
Q178: TABLE 2-14
The table below contains the number
Q191: TABLE 2-17
The following table presents total retail
Unlock this Answer For Free Now!
View this answer and more for free by performing one of the following actions

Scan the QR code to install the App and get 2 free unlocks

Unlock quizzes for free by uploading documents