TABLE 15- 8
The superintendent of a school district wanted to predict the percentage of students passing a sixth- grade proficiency test. She obtained the data on percentage of students passing the proficiency test (% Passing), daily average of the percentage of students attending class (% Attendance), average teacher salary in dollars (Salaries), and instructional spending per pupil in dollars (Spending) of 47 schools in the state.
Let Y = % Passing as the dependent variable, X1 = % Attendance, X2 = Salaries and X3 = Spending.
The coefficient of multiple determination (R 2 j) of each of the 3 predictors with all the other remaining predictors are,
respectively, 0.0338, 0.4669, and 0.4743.
The output from the best- subset regressions is given below:
Adjusted
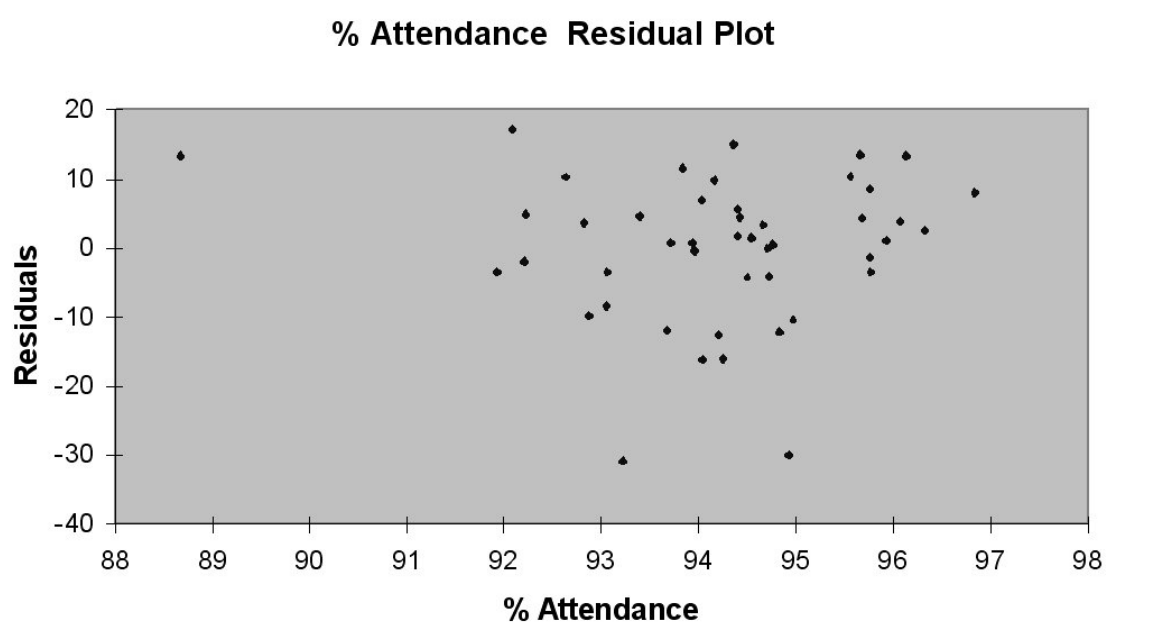
Following is the residual plot for % Attendance:
Following is the residual plot for % Attendance:
Following is the output of several multiple regression models:
-Referring to Table 15-8, there is reason to suspect collinearity between some pairs of predictors.
Correct Answer:
Verified
Q3: Collinearity is present when there is a
Q7: Collinearity is present if the dependent variable
Q8: Collinearity is present when there is a
Q22: In stepwise regression,an independent variable is not
Q30: In data mining where huge data sets
Q36: The goals of model building are to
Q69: TABLE 15-3
A certain type of rare
Q72: TABLE 15-7
A chemist employed by a
Q77: A high value of R2 significantly above
Q79: TABLE 15- 8
The superintendent of a
Unlock this Answer For Free Now!
View this answer and more for free by performing one of the following actions

Scan the QR code to install the App and get 2 free unlocks

Unlock quizzes for free by uploading documents