The prices of Rawlston, Inc. stock (y) over a period of 12 days, the number of shares (in 100s) of company's stocks sold (x1), and the volume of exchange (in millions) on the New York Stock Exchange (x2) are shown below. 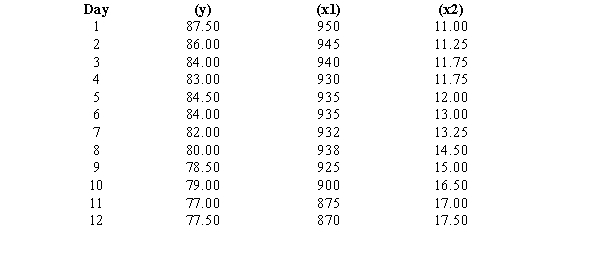 Excel was used to determine the least-squares regression equation. Part of the computer output is shown below.
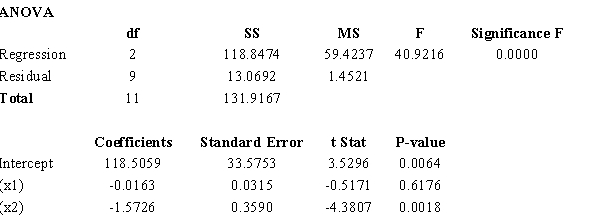
a. Use the output shown above and write an equation that can be used to predict the price of the stock.
b. Interpret the coefficients of the estimated regression equation that you found in Part a.
c. At 95% confidence, determine which variables are significant and which are not.
d. If in a given day, the number of shares of the company that were sold was 94,500 and the volume of exchange on the New York Stock Exchange was 16 million, what would you expect the price of the stock to be?
Correct Answer:
Verified
b.As ...
View Answer
Unlock this answer now
Get Access to more Verified Answers free of charge
Q88: Exhibit 15-8
The following estimated regression model was
Q89: In order to determine whether or not
Q90: Exhibit 15-8
The following estimated regression model was
Q91: Below you are given a computer
Q92: In order to determine whether or
Q94: Exhibit 15-8
The following estimated regression model was
Q95: The following results were obtained from a
Q96: Below you are given a partial
Q97: The following is part of the
Q98: A regression was performed on a
Unlock this Answer For Free Now!
View this answer and more for free by performing one of the following actions

Scan the QR code to install the App and get 2 free unlocks

Unlock quizzes for free by uploading documents