Use the REGRESSION feature on a graphing calculator.
-In the table below,x represents the number of years since 2000 and y represents sales (in thousands of dollars) of a clothing company.Use the regression equation to estimate sales in the year 2006.Round to the nearest thousand dollars. 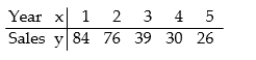
A) $14,000
B) $20,000
C) $2,000
D) $8,000
Correct Answer:
Verified
Q36: Write an equation of the line with
Q41: Use the REGRESSION feature on a graphing
Q42: Use the graph to find the average
Q44: Provide an appropriate response.
-Given two points (x1,y1)and
Q45: Use the REGRESSION feature on a graphing
Q46: Use the REGRESSION feature on a graphing
Q47: Use the REGRESSION feature on a graphing
Q48: Use the graph to find the average
Q50: Use the REGRESSION feature on a graphing
Q69: Solve the problem.
-Suppose the sales of a
Unlock this Answer For Free Now!
View this answer and more for free by performing one of the following actions

Scan the QR code to install the App and get 2 free unlocks

Unlock quizzes for free by uploading documents