Using the graph given below, which of the following equations represents the function shown in the graph? 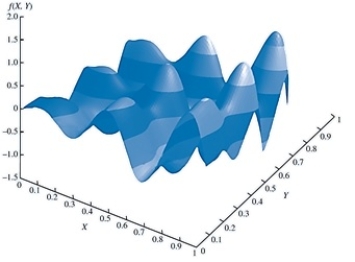
A) f(X, Y) = Xlog(2πY) + Ylog(2πX)
B) f(X, Y) = X - Y
C) f(X, Y) = -X2 - Y2
D) f(X, Y) = Xsin(5πX) + Ysin(5πY)
Correct Answer:
Verified
Q29: In the Bass forecasting model, the _
Q30: One of the ways to use the
Q31: The _ forecasting model uses nonlinear optimization
Q32: The portfolio variance is the
A)sum of the
Q33: If the portfolio variance were equal to
Q35: A portfolio optimization model used to construct
Q36: Solving nonlinear problems with local optimal solutions
Q37: Which of the following is a second
Q38: In the Bass forecasting model, parameter m
A)measures
Q39: Excel Solver's _ is based on a
Unlock this Answer For Free Now!
View this answer and more for free by performing one of the following actions

Scan the QR code to install the App and get 2 free unlocks

Unlock quizzes for free by uploading documents