The percent P of men 65 years of age or older in the labor force can be modeled by 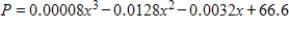 , where x is the number of years past 1890 (Source: U.S. Bureau of the Census) . Plot this function using a graphing utility. What range of x-values and y-values do you need to use to view this graph for the years 1890 to 2010?
A) x-min = 0, x-max = 120 y-min = 0, y-max = 60
B) x-min = -120, x-max = 0 y-min = 0, y-max = 70
C) x-min = -120 , x-max = 120 y-min = 0, y-max = 50
D) x-min = 0, x-max = 90 y-min = 0, y-max = 50
E) x-min = 0, x-max = 120 y-min = 0, y-max = 70
Correct Answer:
Verified
Q164: Suppose that the consumer expenditure E (in
Q165: In a study using 50 foreign-language vocabulary
Q166: The graphs of the two equations below
Q167: Solve the system by elimination, or by
Q168: An advertising agency has found that when
Q170: Suppose the cost C of removing p
Q171: Solve the system of equations by substitution.
Q172: The number (in millions) of U.S. cellular
Q173: Solve the system by elimination, or by
Q174: Solve the system of equations by using
Unlock this Answer For Free Now!
View this answer and more for free by performing one of the following actions

Scan the QR code to install the App and get 2 free unlocks

Unlock quizzes for free by uploading documents