Between the years 1960 and 2002, the percent of women in the work force is given by 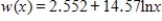 , where x is the number of years past 1950 (Source: U.S. Bureau of Labor Statistics) . Graph this function with a graphing utility and use the graph drawn to estimate the year in which the percent reached 60. Round your answer to the nearest year.
A) 1990
B) 1997
C) 2002
D) 2010
E) 2015
Correct Answer:
Verified
Q58: Write the expression as the sum or
Q59: Use a change-of-base formula to evaluate
Q60: Use the following information. Chemists use the
Q61: The purchasing power P (in dollars) of
Q62: The purchasing power P (in dollars) of
Unlock this Answer For Free Now!
View this answer and more for free by performing one of the following actions

Scan the QR code to install the App and get 2 free unlocks

Unlock quizzes for free by uploading documents