Which frequency table best describes the data displayed in the frequency histogram? 
A) 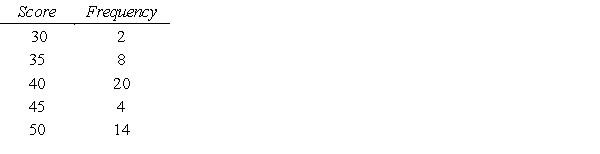
B) 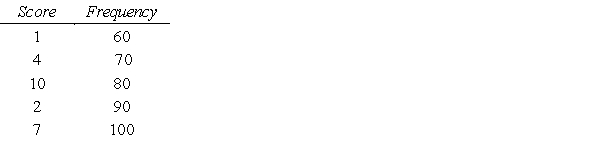
C) 
D) 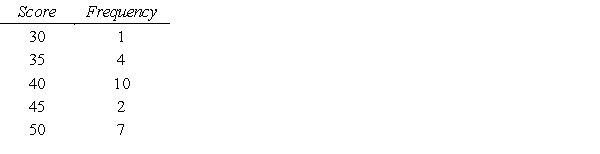
E) 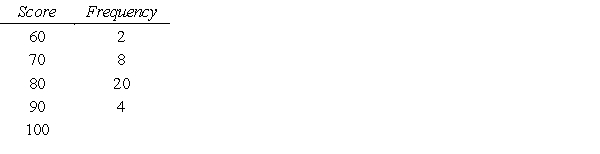
Correct Answer:
Verified
Q27: Find the mean of the following data.
Q28: The following table gives a city's unemployment
Q29: Find the standard deviation of the sample
Q30: A quiz consists of 10 multiple-choice questions
Q31: Find the median of the set of
Q33: Which frequency histogram best describes the data
Q34: Find the median of the set of
Q35: Find the range of the set of
Q36: Suppose the probability of suicide among a
Q37: In a certain community, 35% of the
Unlock this Answer For Free Now!
View this answer and more for free by performing one of the following actions

Scan the QR code to install the App and get 2 free unlocks

Unlock quizzes for free by uploading documents