The following bar graph shows the size of the average farm (in acres) for selected years from 1940 to 2000. Which table shows the data displayed in the graph? 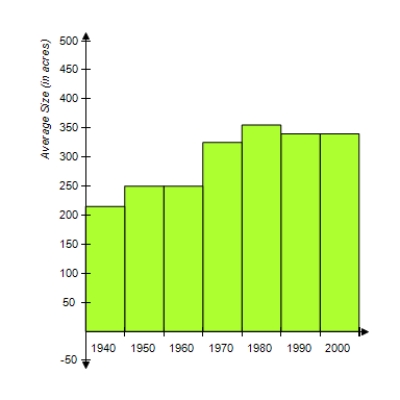
A) 
B) 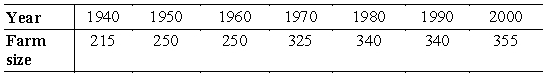
C) 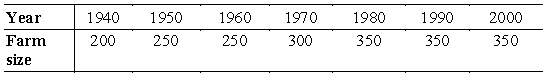
D) 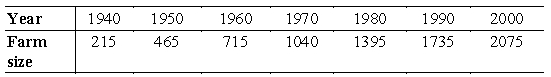
E) 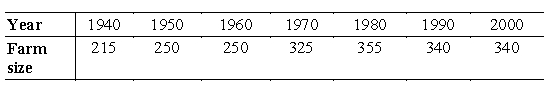
Correct Answer:
Verified
Q42: Determine c, if possible, so that the
Q43: A coin is "loaded" so that the
Q44: The percents of total households that contain
Q45: Estimate the variance for the following probability
Q46: The following table defines a discrete probability
Q48: A variable x has a binomial distribution
Q49: Determine y, if possible, so that the
Q50: Suppose a company has 11 employees, 1
Q51: The birth weights (in kilograms) of a
Q52: Suppose a pair of dice is thrown
Unlock this Answer For Free Now!
View this answer and more for free by performing one of the following actions

Scan the QR code to install the App and get 2 free unlocks

Unlock quizzes for free by uploading documents