College students were surveyed to determine how much they planned to spend in various categories during the upcoming academic year. One category is the amount spent on school supplies. The graphs below show the amount of money spent on school supplies by women and men. 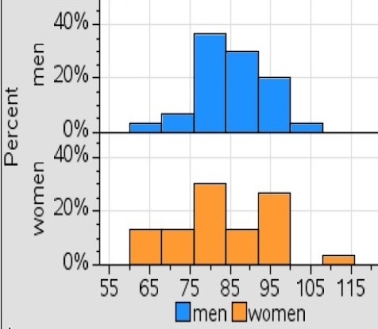 Approximately what percent of women spend more than $105 on school supplies?
A) 5%
B) 10%
C) 15%
D) 20%
Correct Answer:
Verified
Q8: The difference between the lower class limits
Q18: Categorical data can be graphically represented by
Q26: Excel's _ can be used to construct
Q27: To construct a pie chart using Excel's
Q28: A _ can be used to graphically
Q29: A graphical device for depicting categorical data
Q32: Frequency distributions can be made for _.
A)
Q33: Excel's Chart Tools can be used to
Q34: When using Excel to create a _,
Q35: A(n) _ is a graph of a
Unlock this Answer For Free Now!
View this answer and more for free by performing one of the following actions

Scan the QR code to install the App and get 2 free unlocks

Unlock quizzes for free by uploading documents