Shrimp From 1982 to 1990, there was a decrease in the number of white shrimp harvested from the Galveston Bay. Here is the regression analysis and a residual plot. The year has been shortened to two digits (82, 83……) and the dependent variable is the number of shrimp collected per hour.
Dependent Variable: Shrimp/hour
s: 6.0232354
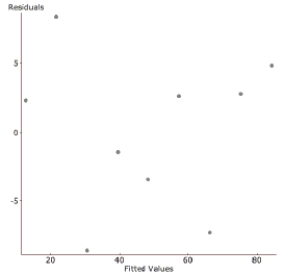
a. Write the regression equation and define your variables. b. Find the correlation coefficient and interpret it in context. c. Interpret the value of the slope in context.
d. In 1991, the shrimp production rebounded (in part due to the effects of El Nino) to 81 shrimp/hour. Find the value of this residual.
e. The prediction for 1991 was very inaccurate. What name do statisticians give to this kind of prediction error?
^
Correct Answer:
Verified
b. -0.974; Th...
View Answer
Unlock this answer now
Get Access to more Verified Answers free of charge
Q13: Do you think a linear model is
Q90: The following scatterplot shows a relationship between
Q91: An article in the Journal of
Q92: Students A growing school district tracks
Q94: A plot of the residuals versus the
Q96: Mistakes. Describe the mistake made in the
Q97: Associations For each pair of variables, indicate
Q98: Height and weight Suppose that both height
Q99: In an effort to decide if
Q100: In an effort to decide if
Unlock this Answer For Free Now!
View this answer and more for free by performing one of the following actions

Scan the QR code to install the App and get 2 free unlocks

Unlock quizzes for free by uploading documents