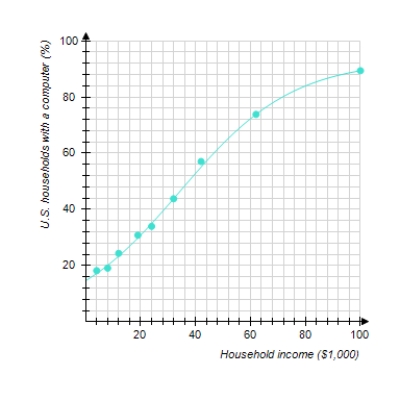
The graph shows the actual percentage of U.S. households with a computer as a function of household income (the data points) and a logistic model of these data (the curve) . The logistic model is
Where x is the household income in thousands of dollars. According to the model, what percentage of extremely wealthy households had computers
A) is close to .
B) is close to .
C) is close to .
D) is close to .
E) is close to .
Correct Answer:
Verified
Q13: The following graph shows the actual
Q14: Choose the logistic function that best
Q15: Choose the logistic function that best
Q16: Choose the logistic function that best
Q17: Use technology to find a logistic
Q19: Find the logistic function f with
Q20: Choose the logistic function that best
Q21: Find the associated doubling time.
Q22: Choose the logistic function that best
Q23: Soon after taking an aspirin, a patient
Unlock this Answer For Free Now!
View this answer and more for free by performing one of the following actions

Scan the QR code to install the App and get 2 free unlocks

Unlock quizzes for free by uploading documents