Given the graph of the functions and . Identify which graph corresponds to . 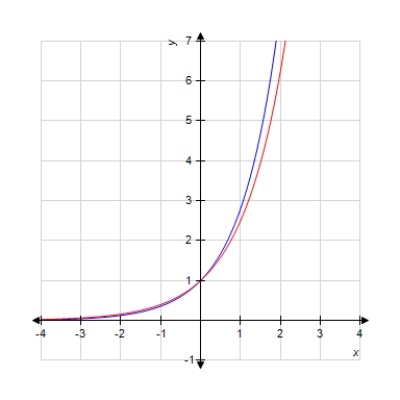
Select the correct answer.
A) Blue
B) Red
Correct Answer:
Verified
Q44: Model the data using an exponential
Q45: Find the associated exponential decay model.
Q46: How long, to the nearest year,
Q47: Rock Solid Bank & Trust is offering
Q48: Which of the following five functions
Q50: The U.S. population was 170 million in
Q51: The table lists interest rates on
Q52: Soon after taking an aspirin, a patient
Q53: Convert the exponential function to the
Q54: Graph the function.
Unlock this Answer For Free Now!
View this answer and more for free by performing one of the following actions

Scan the QR code to install the App and get 2 free unlocks

Unlock quizzes for free by uploading documents