The following chart shows the value of trade between two countries for the period 1994 - 2004 ( represents 1994) . 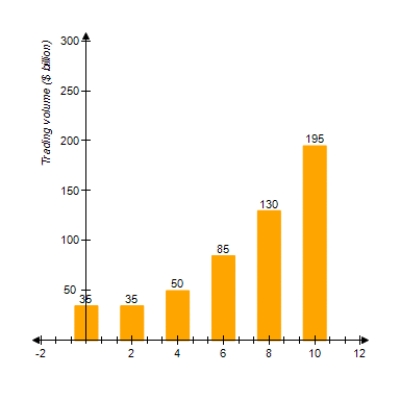
Which of the following models best approximates the data given (Try to answer this without actually computing values.)
A)
B)
C)
D)
E)
Correct Answer:
Verified
Q57: The table below is filled correctly.
Q58: Find an equation for an exponential
Q59: Given the graph of the functions
Q60: The table is filled correctly.
Q61: Suppose the amount of carbon dioxide
Q63: Find the vertex of the graph
Q64: Model the data using an exponential
Q65: For the following demand equation, find
Q66: The given table corresponds to the
Q67: The U.S. population was 170 million in
Unlock this Answer For Free Now!
View this answer and more for free by performing one of the following actions

Scan the QR code to install the App and get 2 free unlocks

Unlock quizzes for free by uploading documents