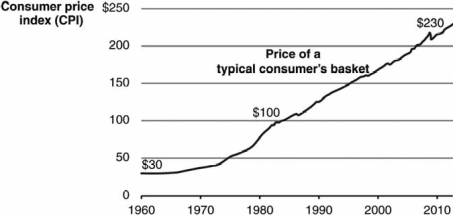
Use the graph shown to discuss, in qualitative terms, the changes in the U.S. inflation rate from 1960 to 2012. Then estimate the inflation rate in 2012.
Correct Answer:
Verified
View Answer
Unlock this answer now
Get Access to more Verified Answers free of charge
Q142: Arguably there are three reasons why the
Q146: Which nation,at one point in the post-World
Q147: The consumer price index (CPI)and the gross
Q149: Describe the methodology of finding the consumer
Q152: Which case in the below table
Q154: Explain how to calculate the inflation rate
Q155: What is one reason why a government
Q159: By definition,the velocity of money is the
A)
Q162: Explain the notion of money illusion in
Q173: Suppose a government prints a large
Unlock this Answer For Free Now!
View this answer and more for free by performing one of the following actions

Scan the QR code to install the App and get 2 free unlocks

Unlock quizzes for free by uploading documents