The figure given below shows the income-expenditure model.Which of the following best describes the situation at point B?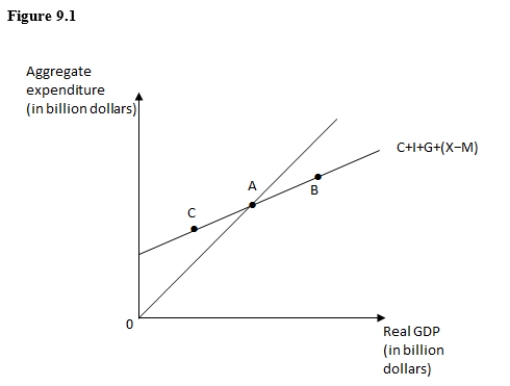
A) Consumption expenditure exceeds disposable income
B) Real GDP exceeds aggregate expenditure
C) Aggregate expenditure is exactly equal to real GDP
D) Aggregate expenditure exceeds real GDP
E) Producers experience an unexpected accumulation of inventory
Correct Answer:
Verified
Q60: A household that expects a decrease in
Q61: The table given below shows the
Q62: The table given below shows the
Q63: The table given below shows the
Q64: If planned spending exceeds planned output in
Q66: The amount of U.S.exports to the rest
Q67: Identify the correct statement about net exports.
A)The
Q68: The aggregate output demanded for a given
Q69: In the simple aggregate expenditure model,the slope
Q70: At the equilibrium level of real gross
Unlock this Answer For Free Now!
View this answer and more for free by performing one of the following actions

Scan the QR code to install the App and get 2 free unlocks

Unlock quizzes for free by uploading documents